
Investing Tools: Adding alt-data with TickerTrends

For someone who likes to identify inflection points in stocks, looking at alternative data can be a huge advantage. Oftentimes, you can observe a surge in consumer interest before the market picks up on it.
While relying on tools like Google Trends can be helpful, I recently came across a much better tool: TickerTrends. I’ve been playing around with the TickerTrends enterprise version, and I have been very impressed. I’ve been using it daily to track consumer interest in my holdings and as a way to potentially generate new ideas.
I rarely recommend specific software, but I thought I’d make an exception for this one because I’ve found it quite useful and believe it could be a valuable addition to your toolkit.
Disclosure: I have a referral arrangement with TickerTrends. If a reader signs up for TickerTrends’ free trial and later upgrades to an enterprise plan through my recommendation, I will receive one year of the service free as a referral reward, with no cost to you.
So what is TickerTrends?
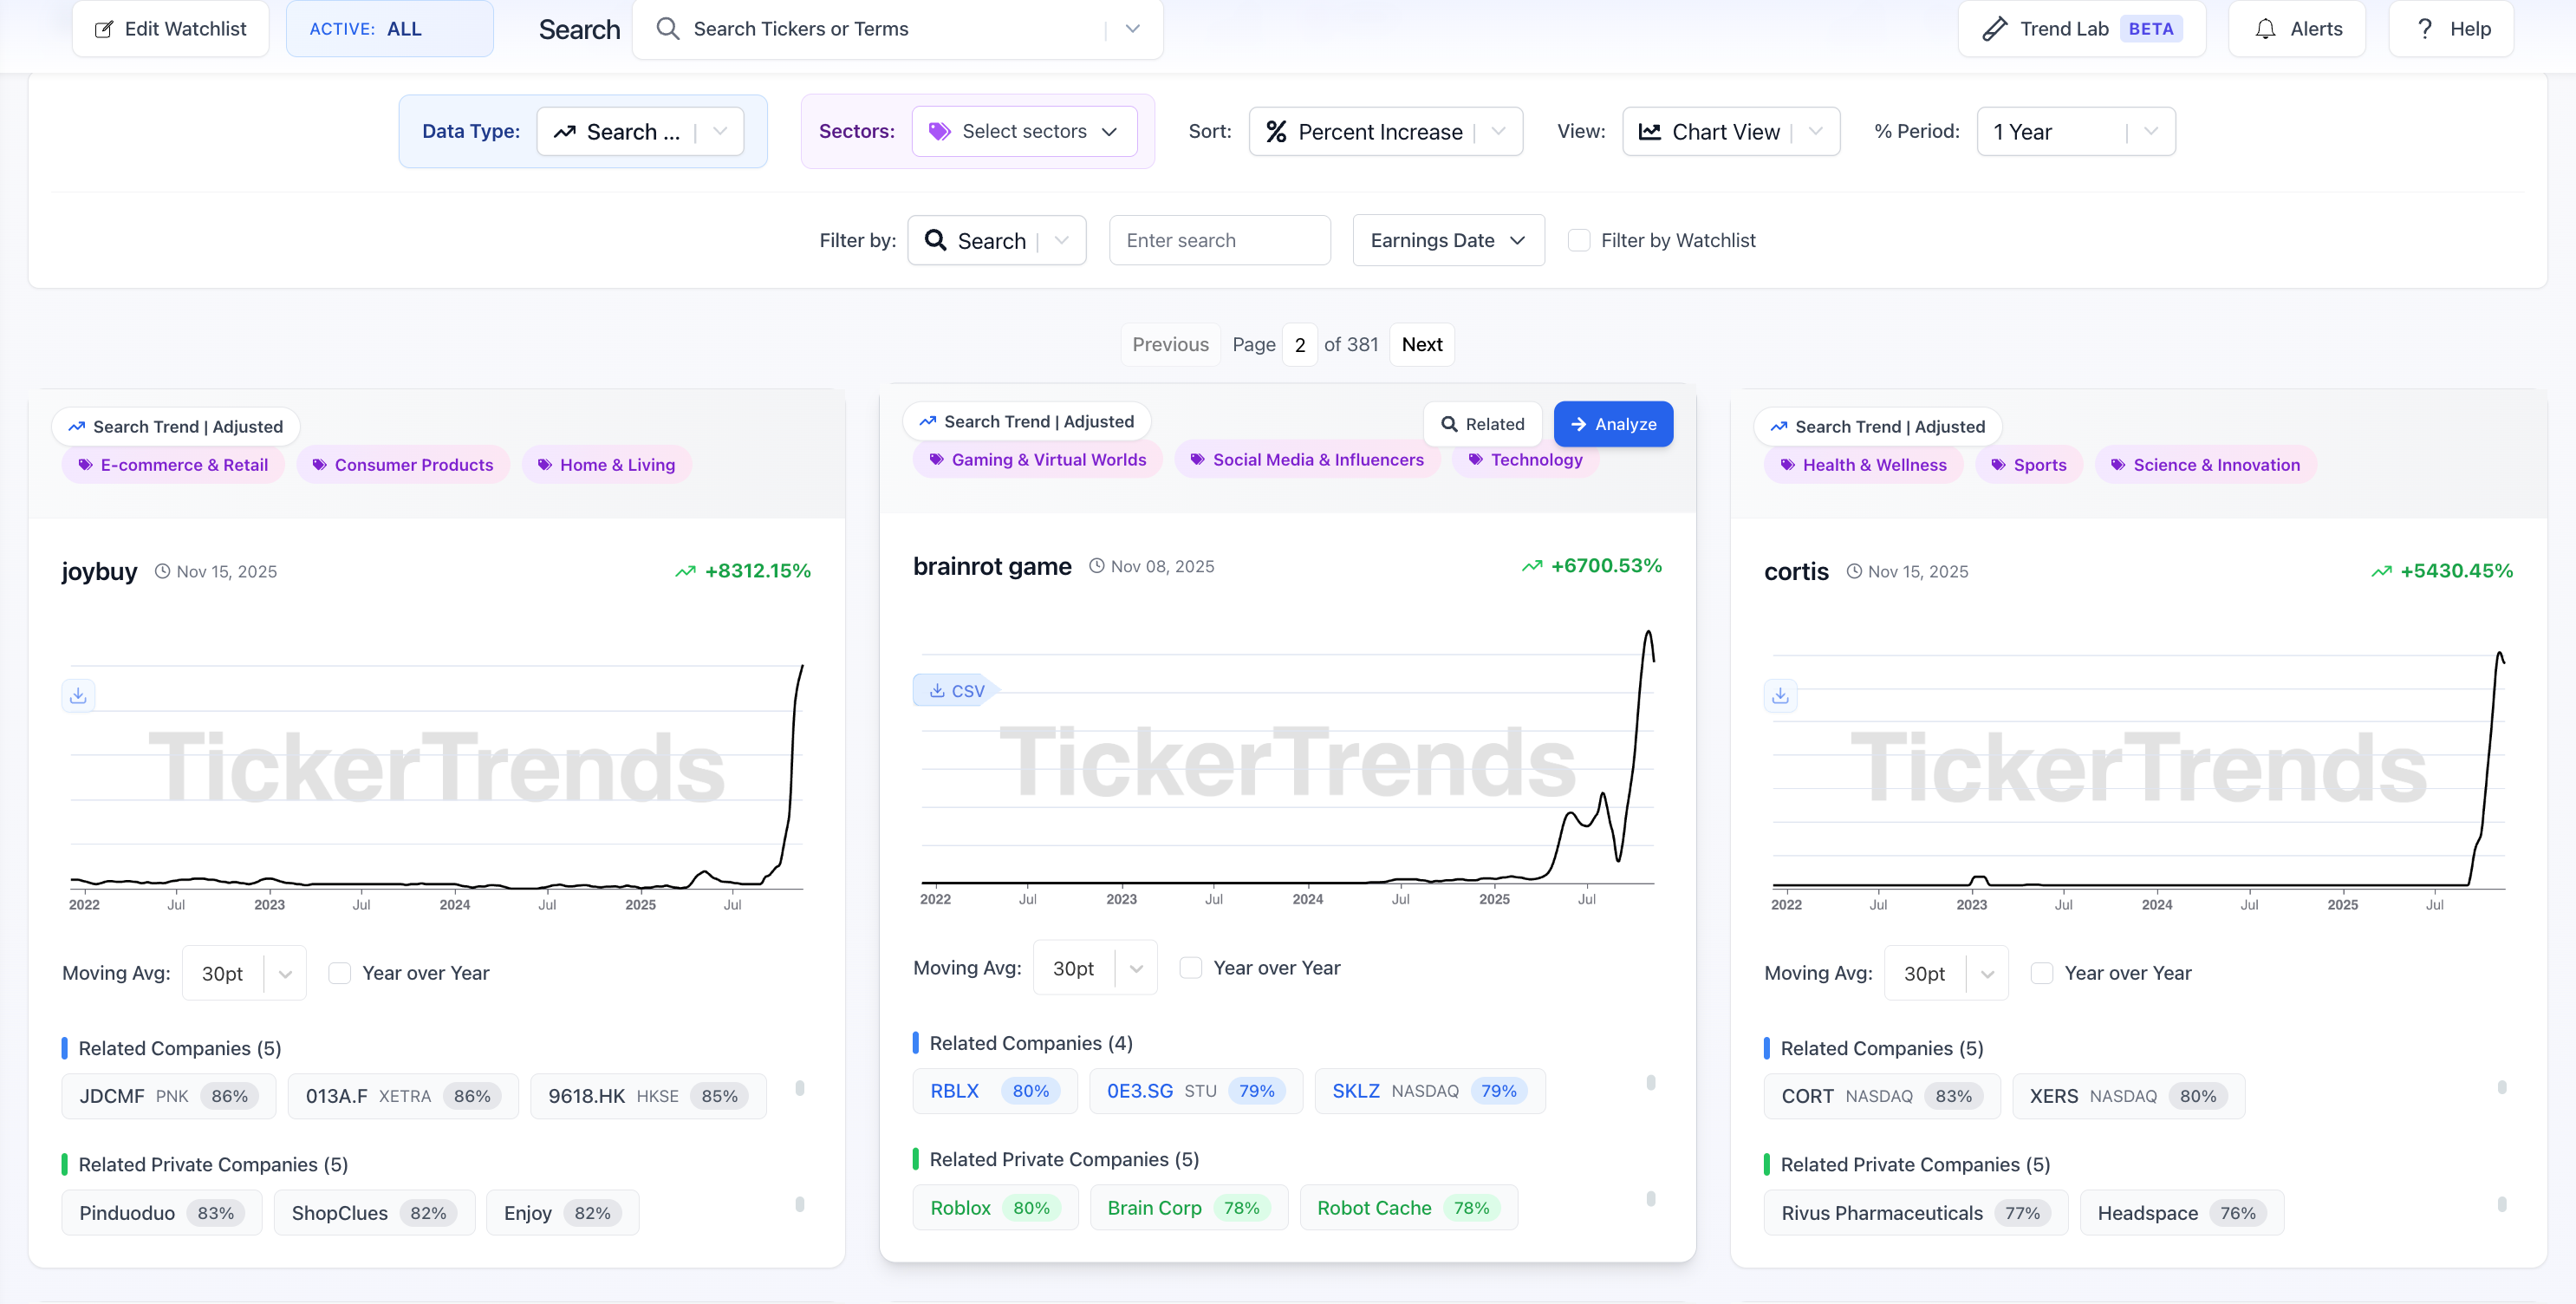
TickerTrends helps investors spot early market trends by analyzing data from Google search volumes, Reddit, Twitter, TikTok, web traffic, e-commerce platforms, and app usage.
There’s a ton of functionality, and I’m sure I won’t cover it all, but I’ll walk you through a few examples of how I’ve been using the platform in my research.
Let’s take a look at a real example — Tonies (GER: TNIE) — a company we own in the portfolio. Tonies is a company that sells an audio system for children, consisting of a screen-free player called the Toniebox and magnetic figurines called Tonies, which are placed on the box to play stories, songs, and other audio content. It’s the perfect type of consumer company to research, given its consumer-facing nature.
For Tonies, TickerTrends provides two proprietary KPIs — consumer and social interest — that aggregate data from different sources, including search trends, web traffic, social media views, etc. [Note: for more popular names, TickerTrends often has more proprietary KPIs and sometimes even KPI predictions.]
Consumer Interest tracks how often people search for a company, product, or topic across platforms such as Google. Social interest measures how frequently a topic or ticker is mentioned across social platforms such as Reddit, Twitter, and TikTok. It captures buzz, sentiment, and the velocity of online conversation.
Social interest can better showcase top-of-funnel interest, while consumer interest shows interest closer to the actual sale.
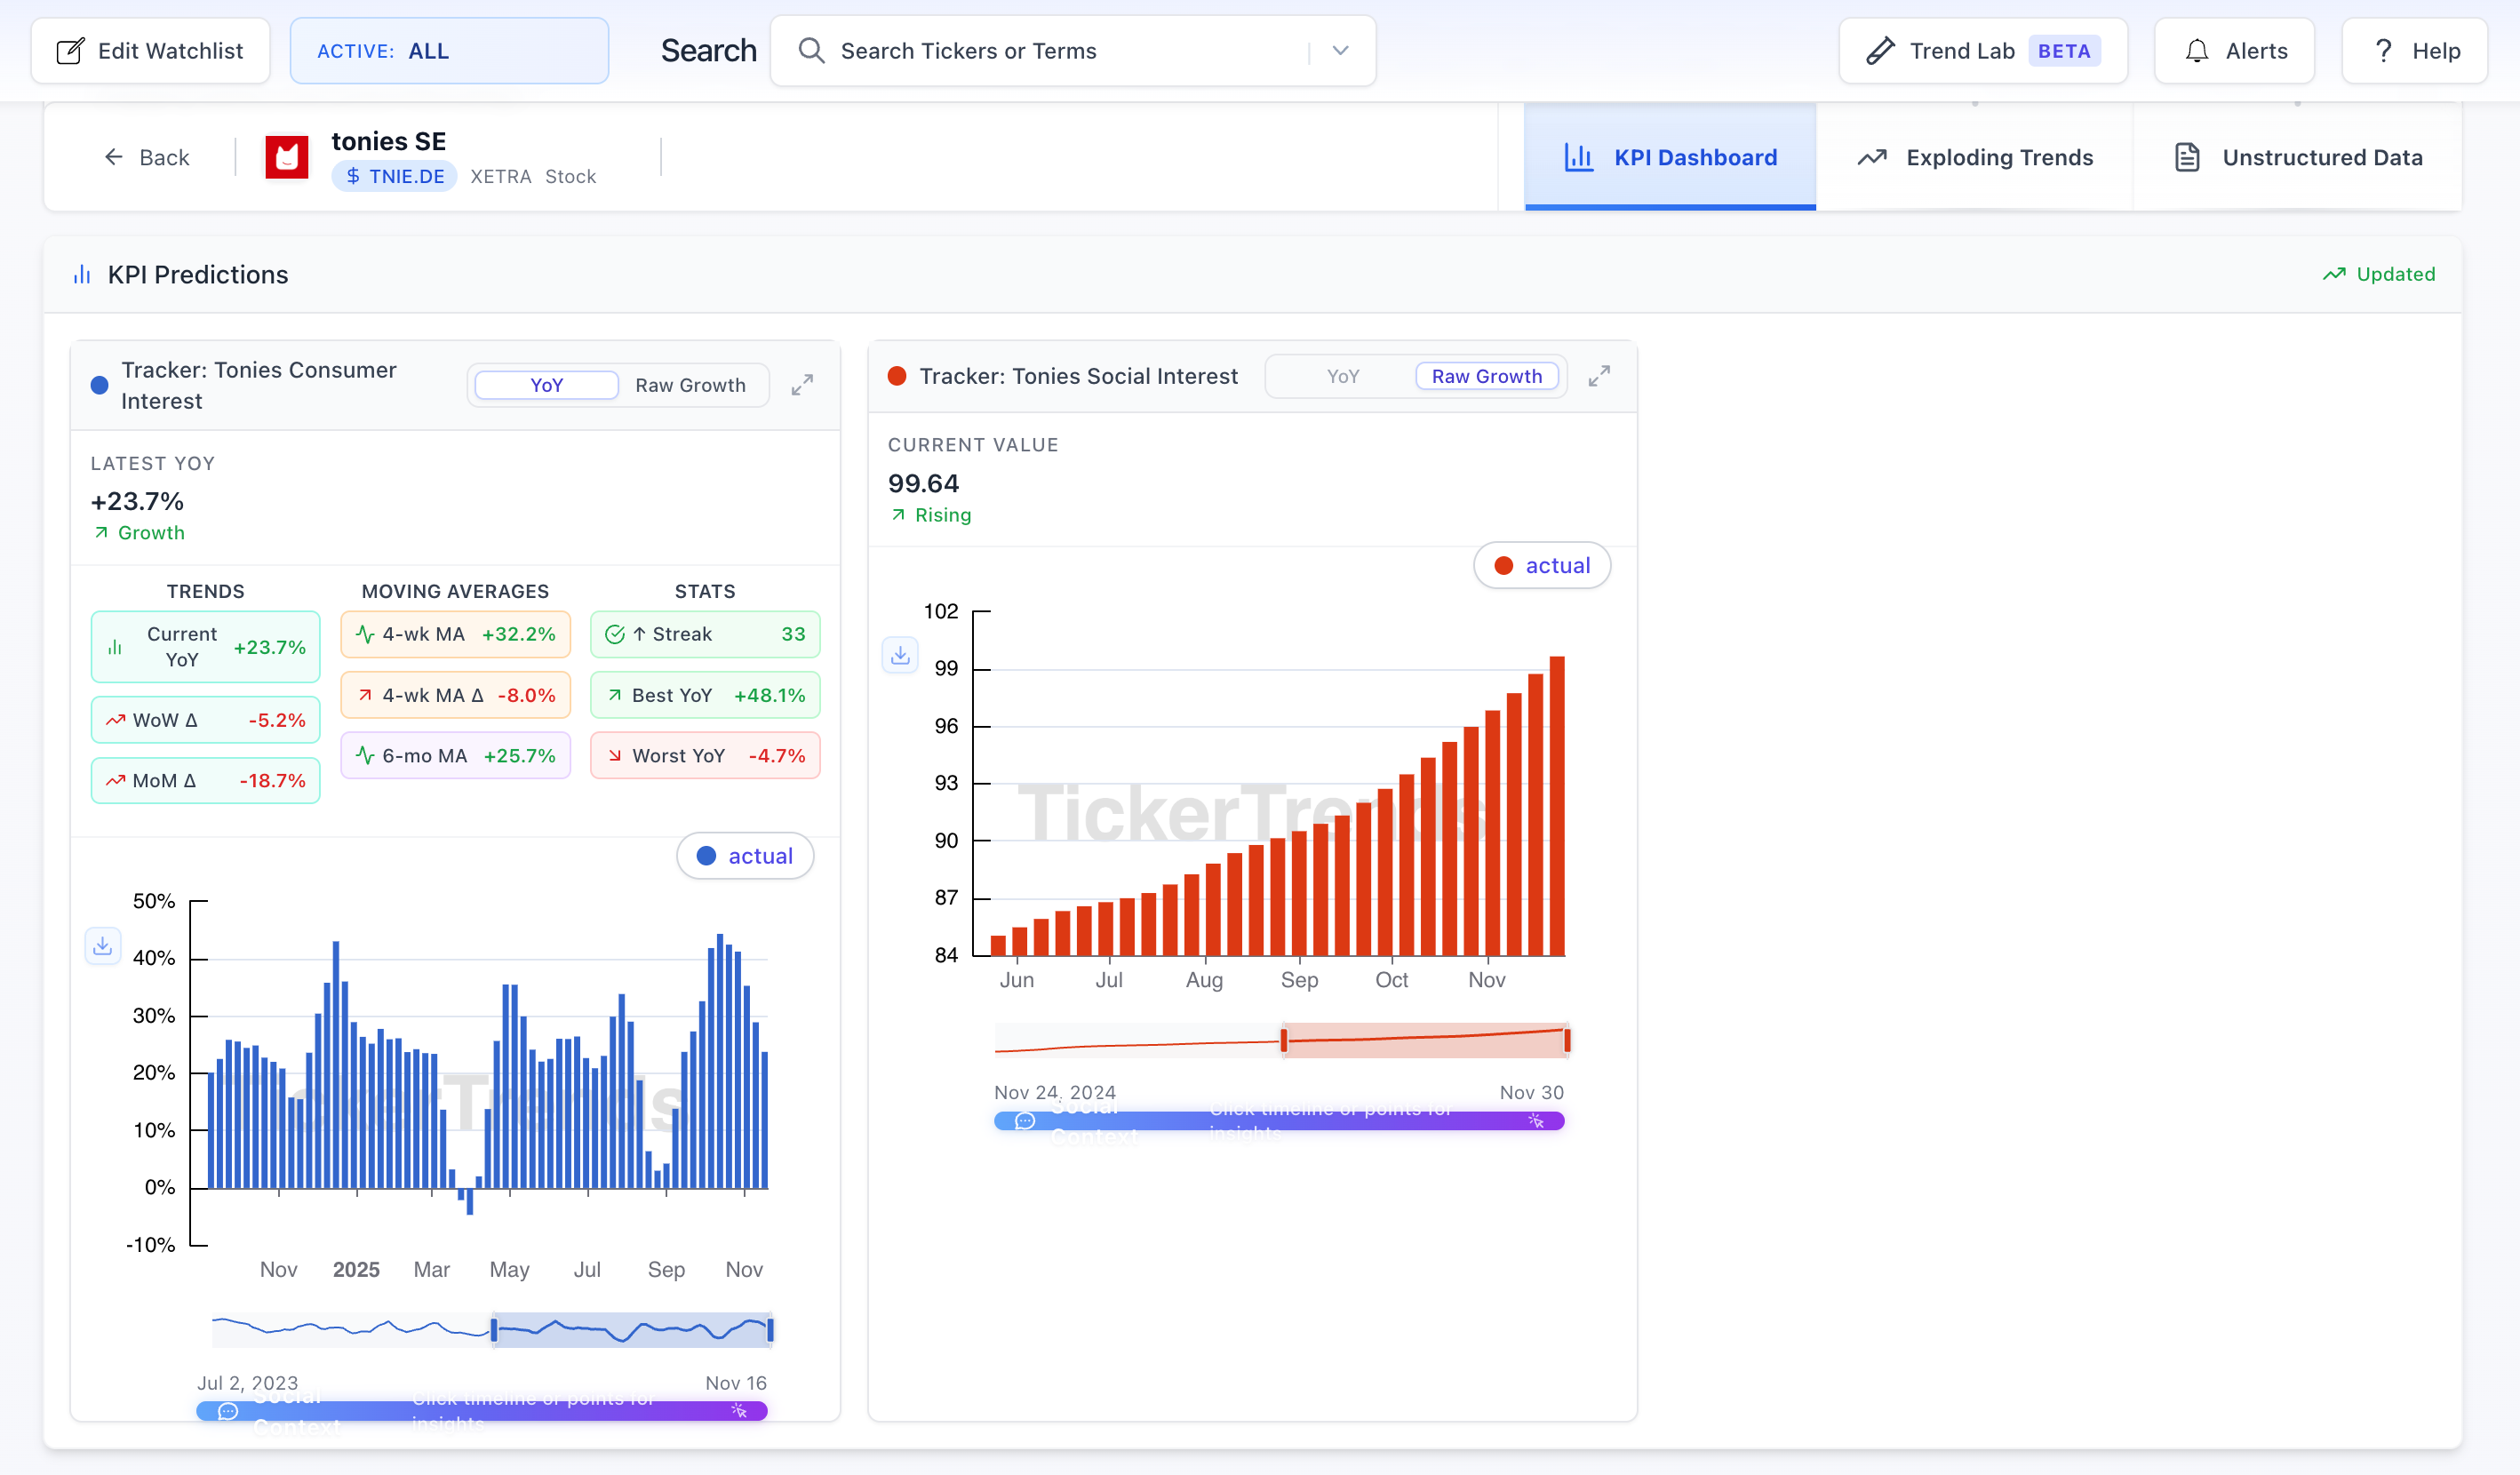
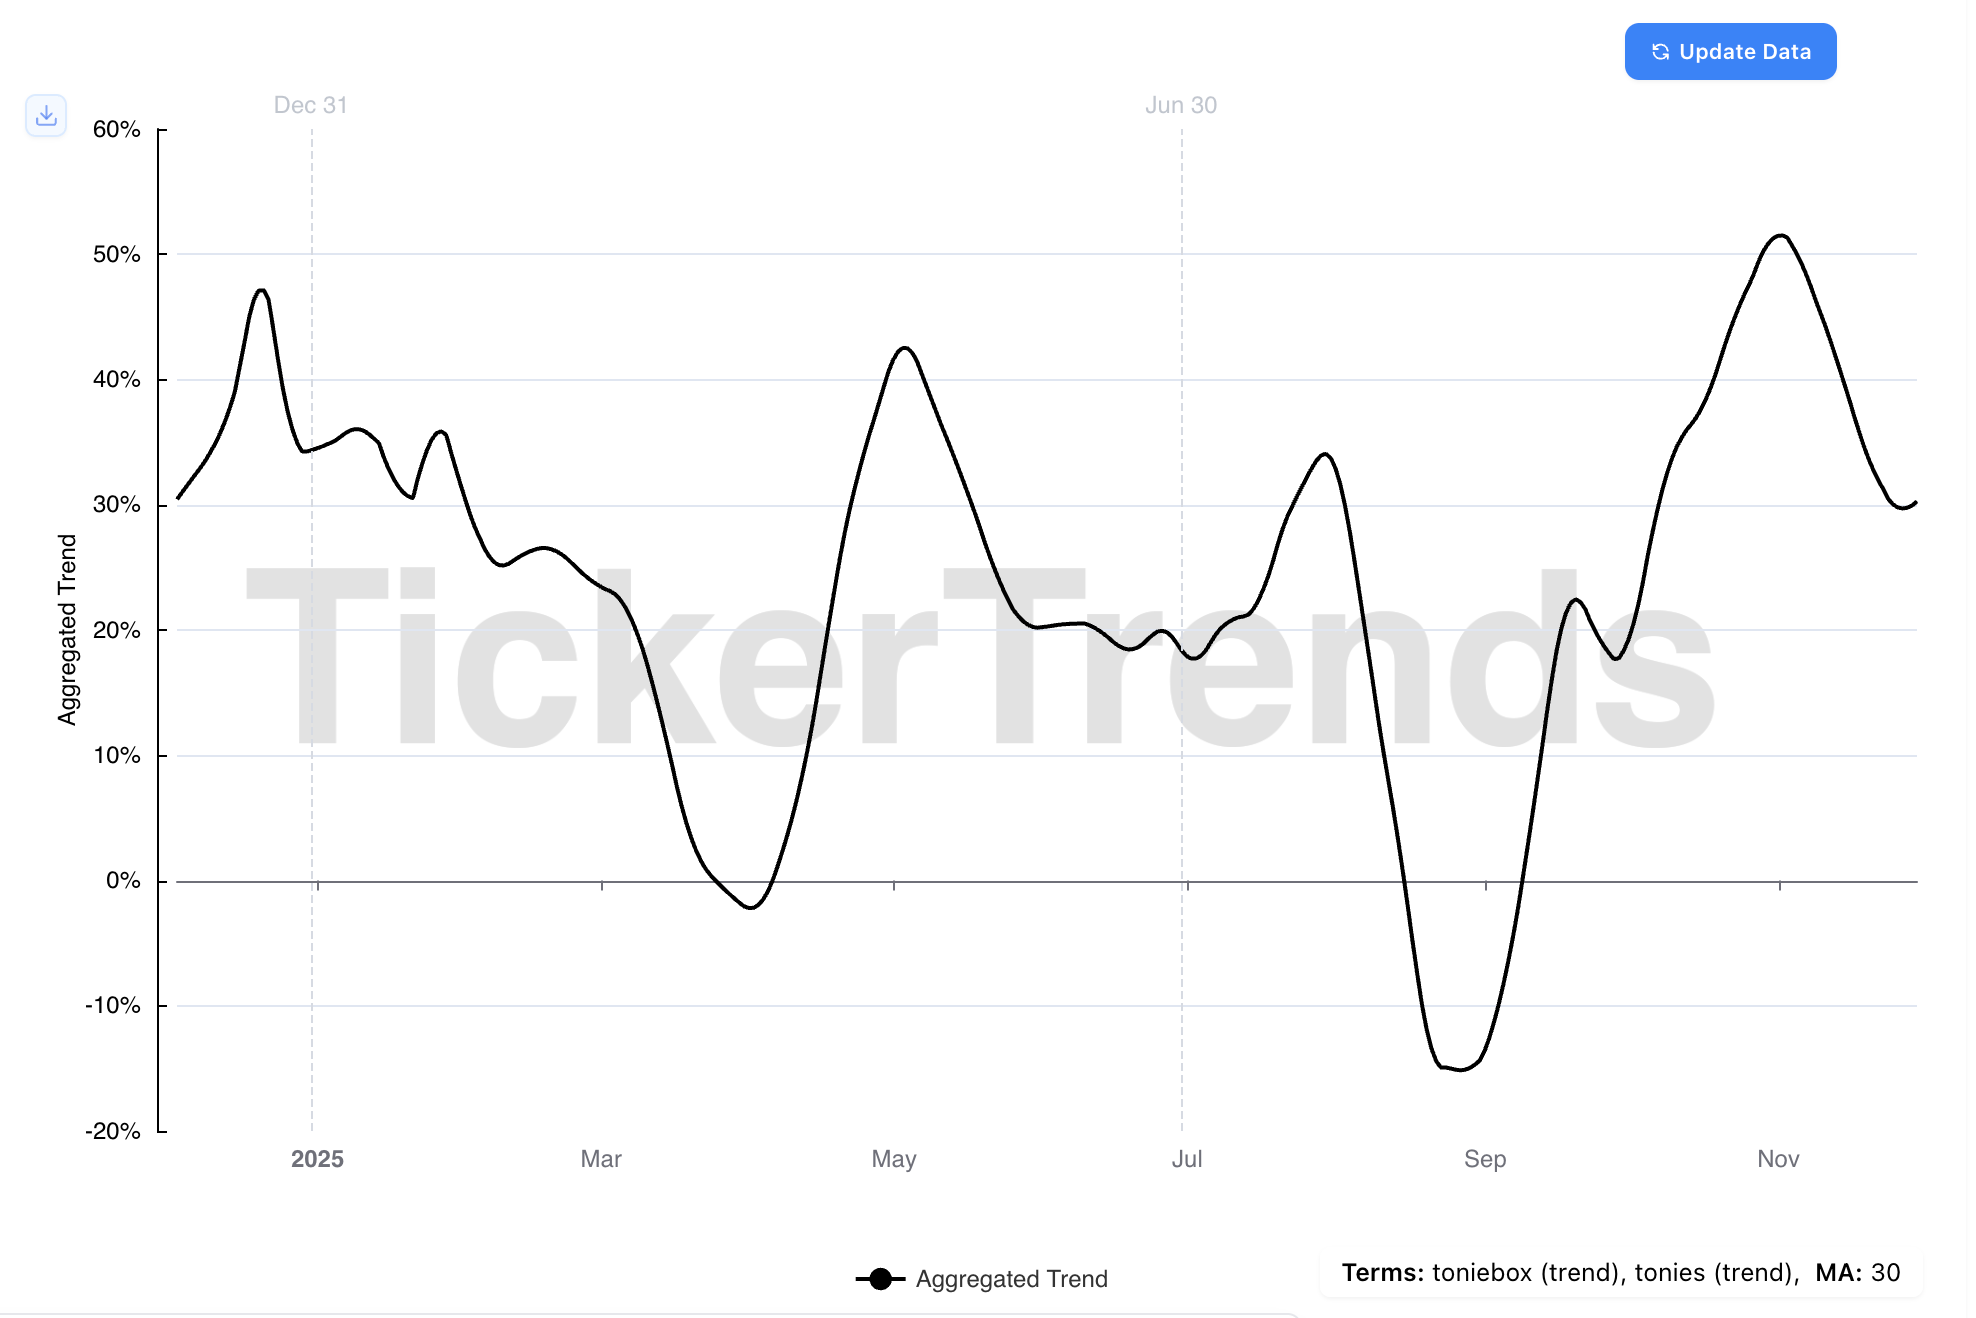
An acceleration in consumer interest can be a good signal that a company or product is resonating with consumers. For Tonies, you can see this measure accelerate from September to November, as the company released the Toniebox 2, which has been a big success thus far. What’s particularly helpful here is the rate-of-change indicators, which track changes on a week-to-week and month-to-month basis and can help surface shifts in consumer engagement.
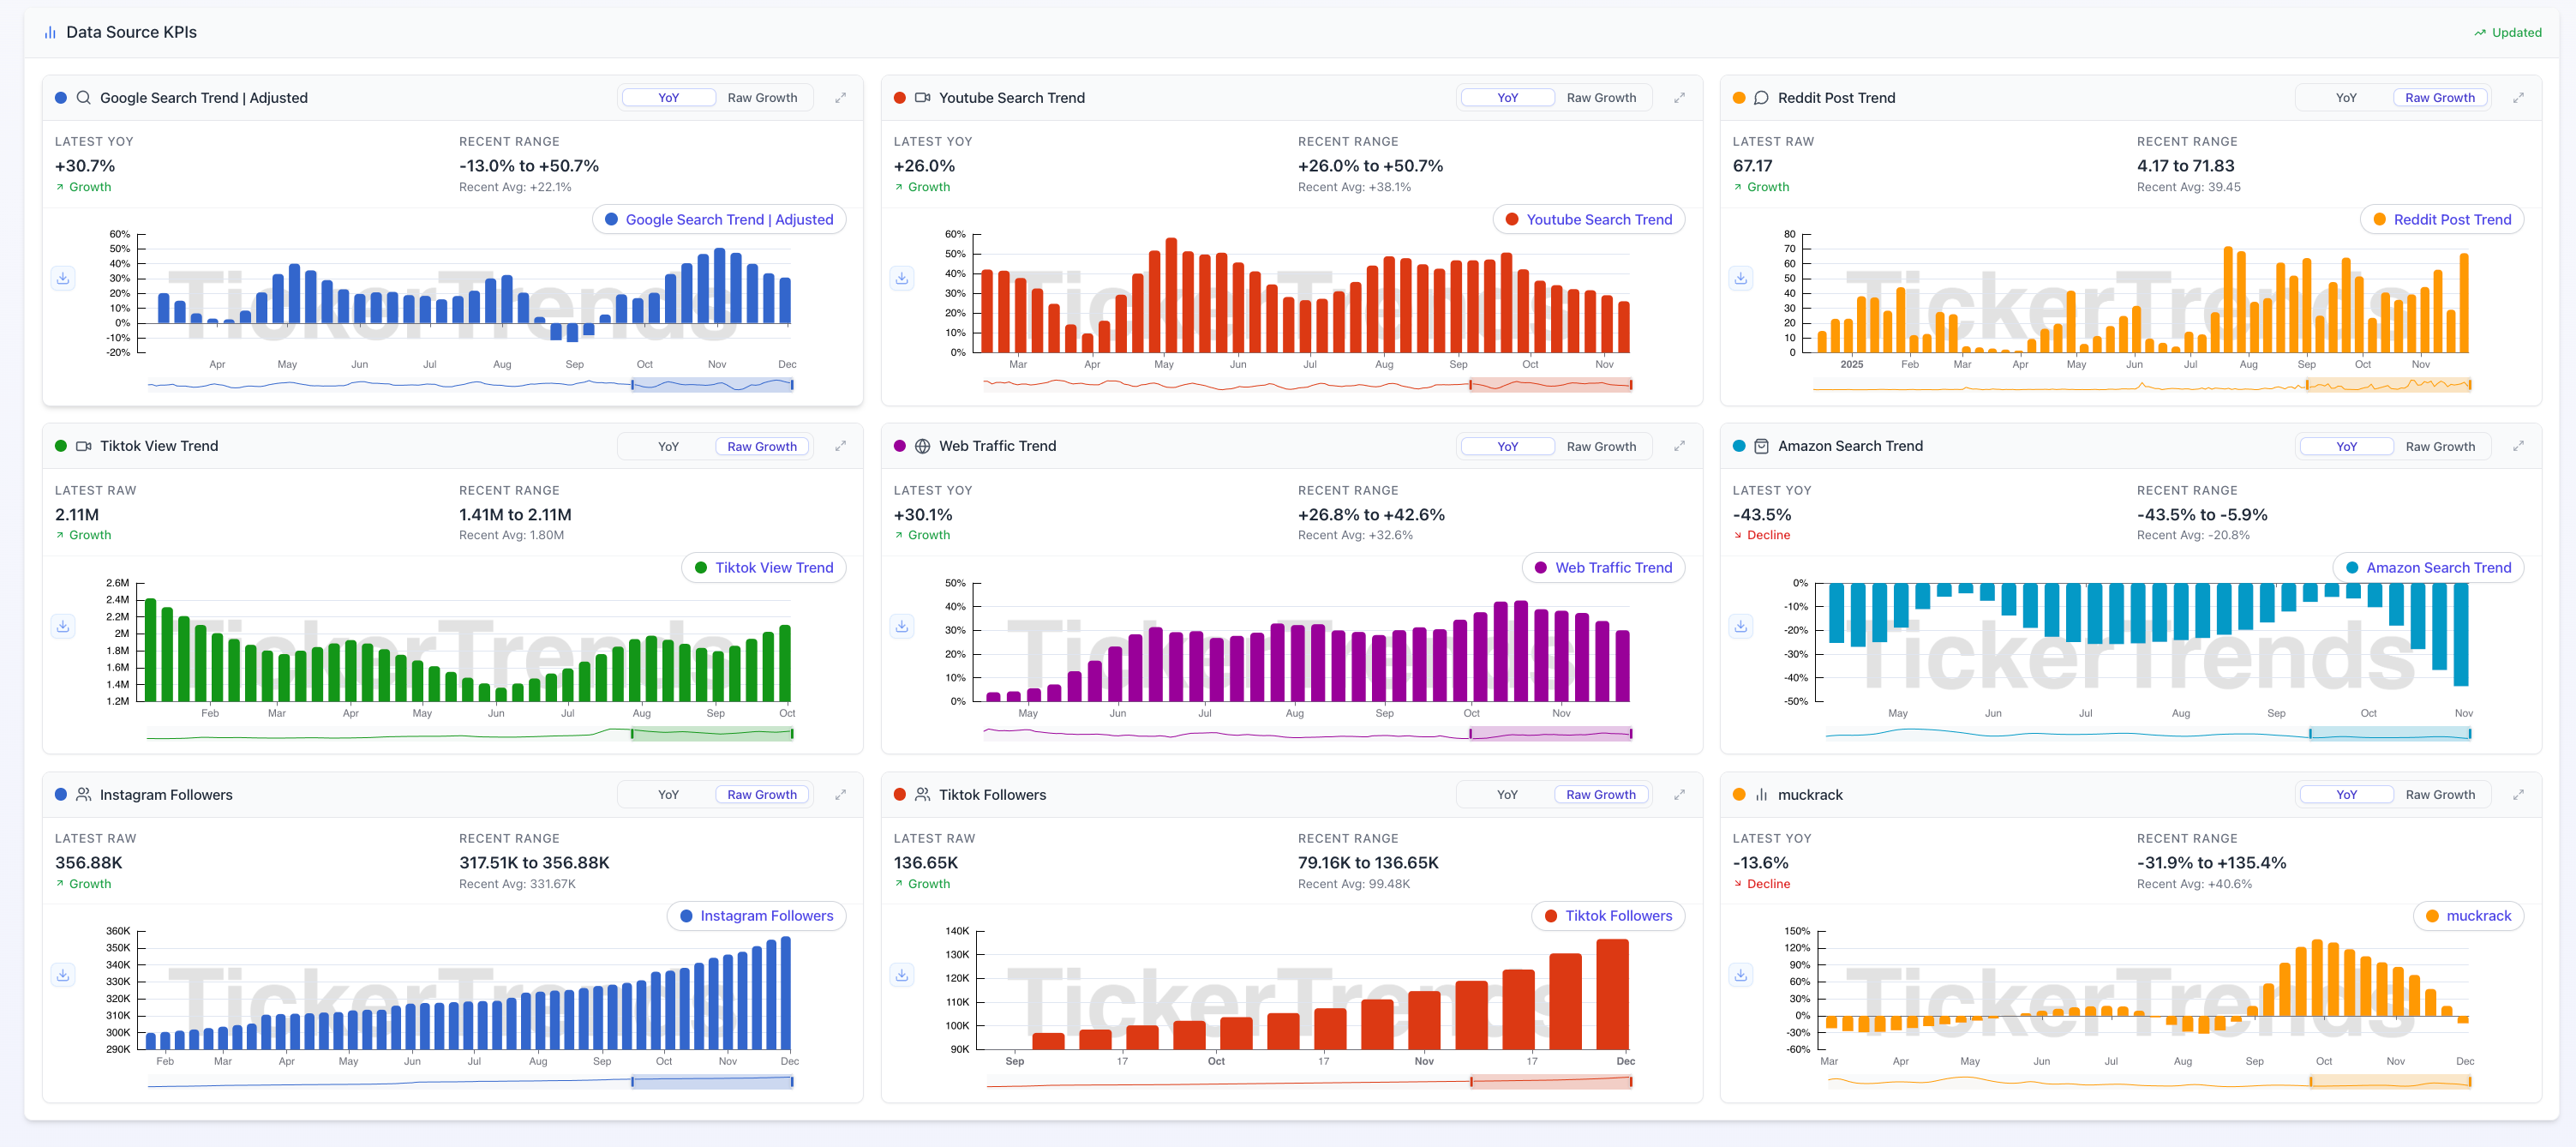
Below that, you can see the data sources that make up these KPIs. For TNIE, these include: Google searches, YouTube searches, Reddit posts, TikTok views, web traffic trends, Amazon search trends, and Instagram.
Another really cool feature — and my favorite — is the unstructured data tab, where you can easily pull and graph data from these different sources.
For instance, you can graph search trends for different words. For TNIE, I like to look at “tonies” and “toniebox” to gauge consumer demand.
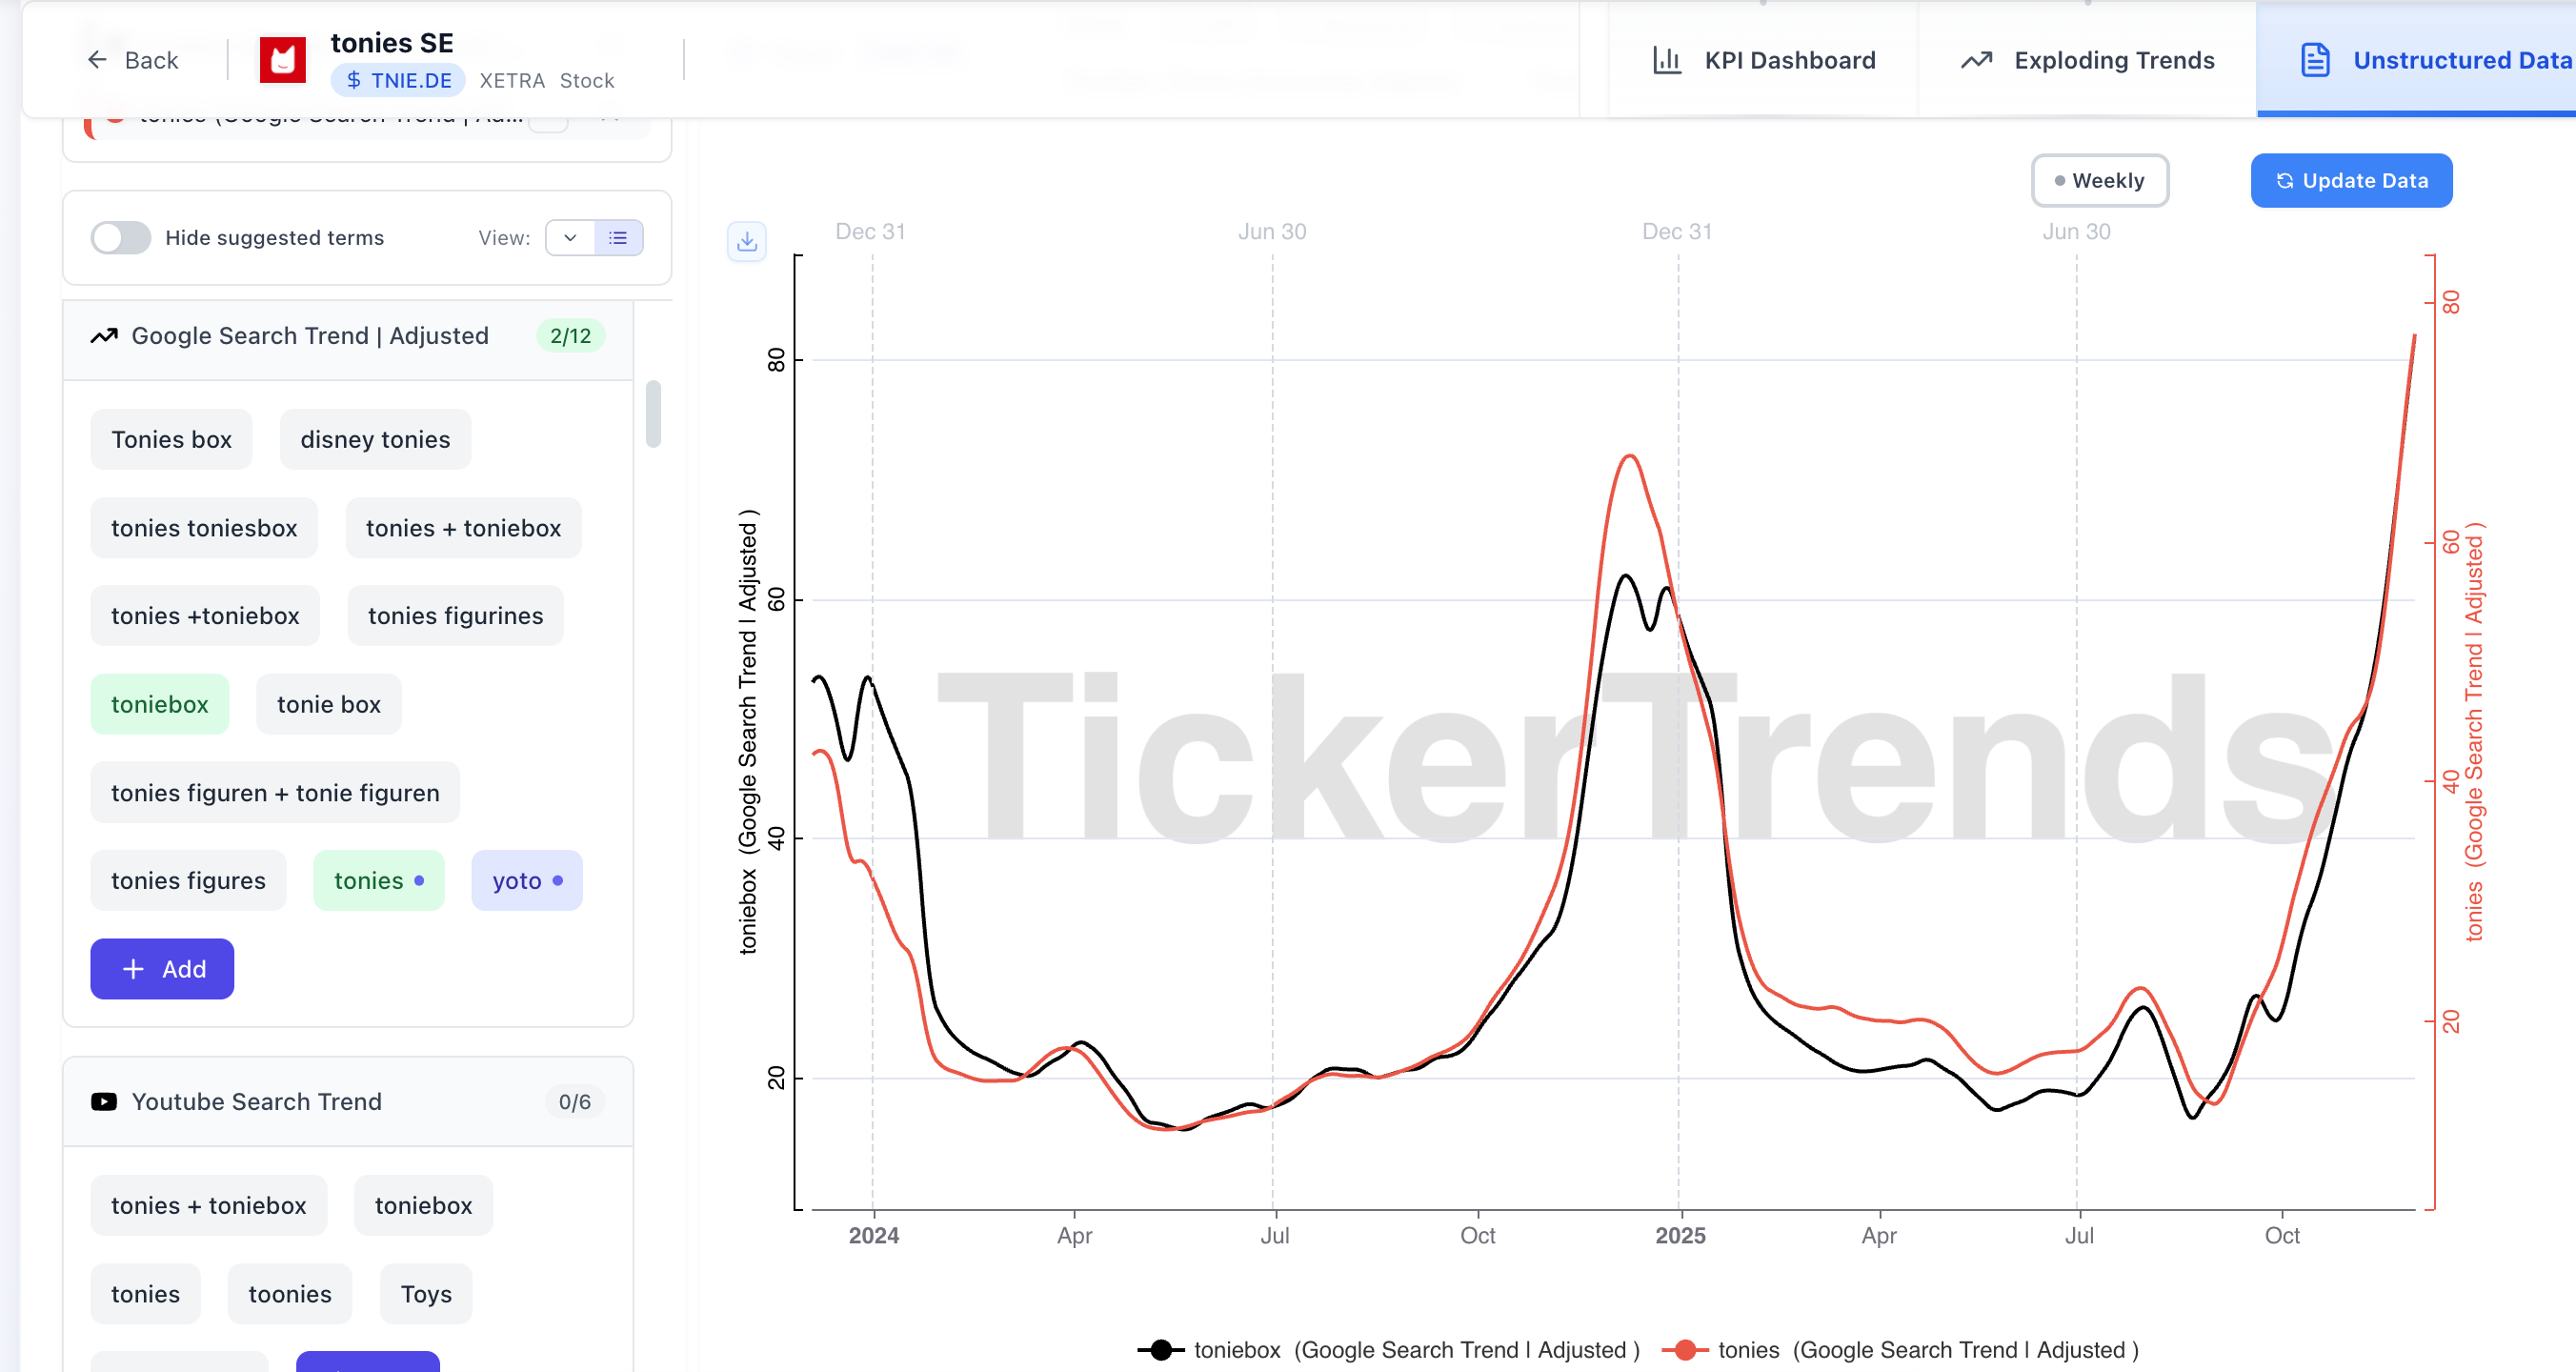
What I find particularly helpful is to change the data to year-on-year changes rather than look at absolute levels. Here is the same graph on a year-on-year basis:
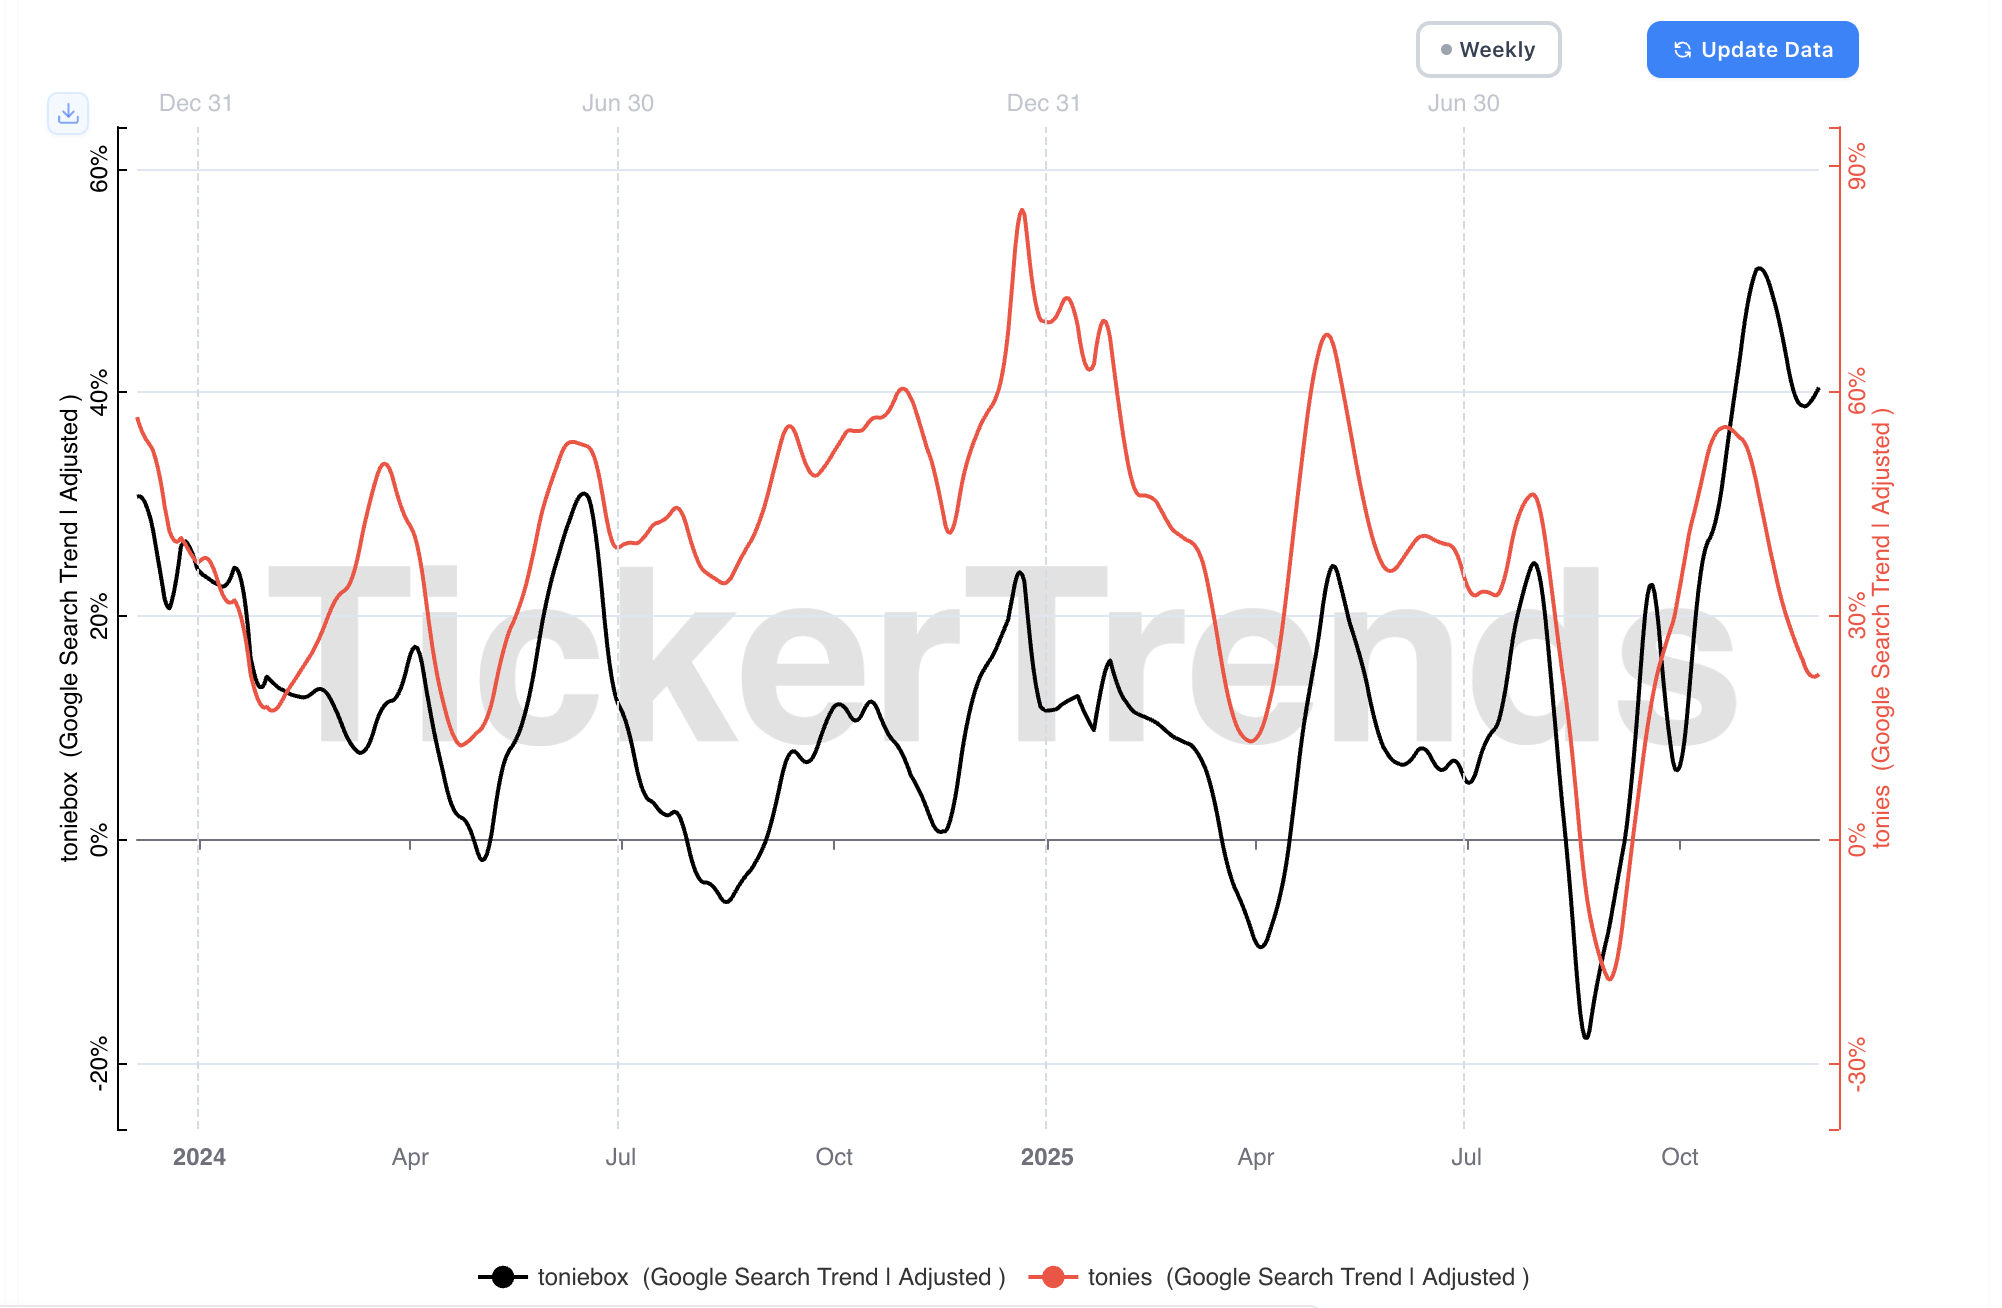
Sometimes you want to look at multiple datasets in aggregate form. You can do that easily. Here is the chart showing year-over-year search interest for both Tonies and Tonieboxes. Very cool.
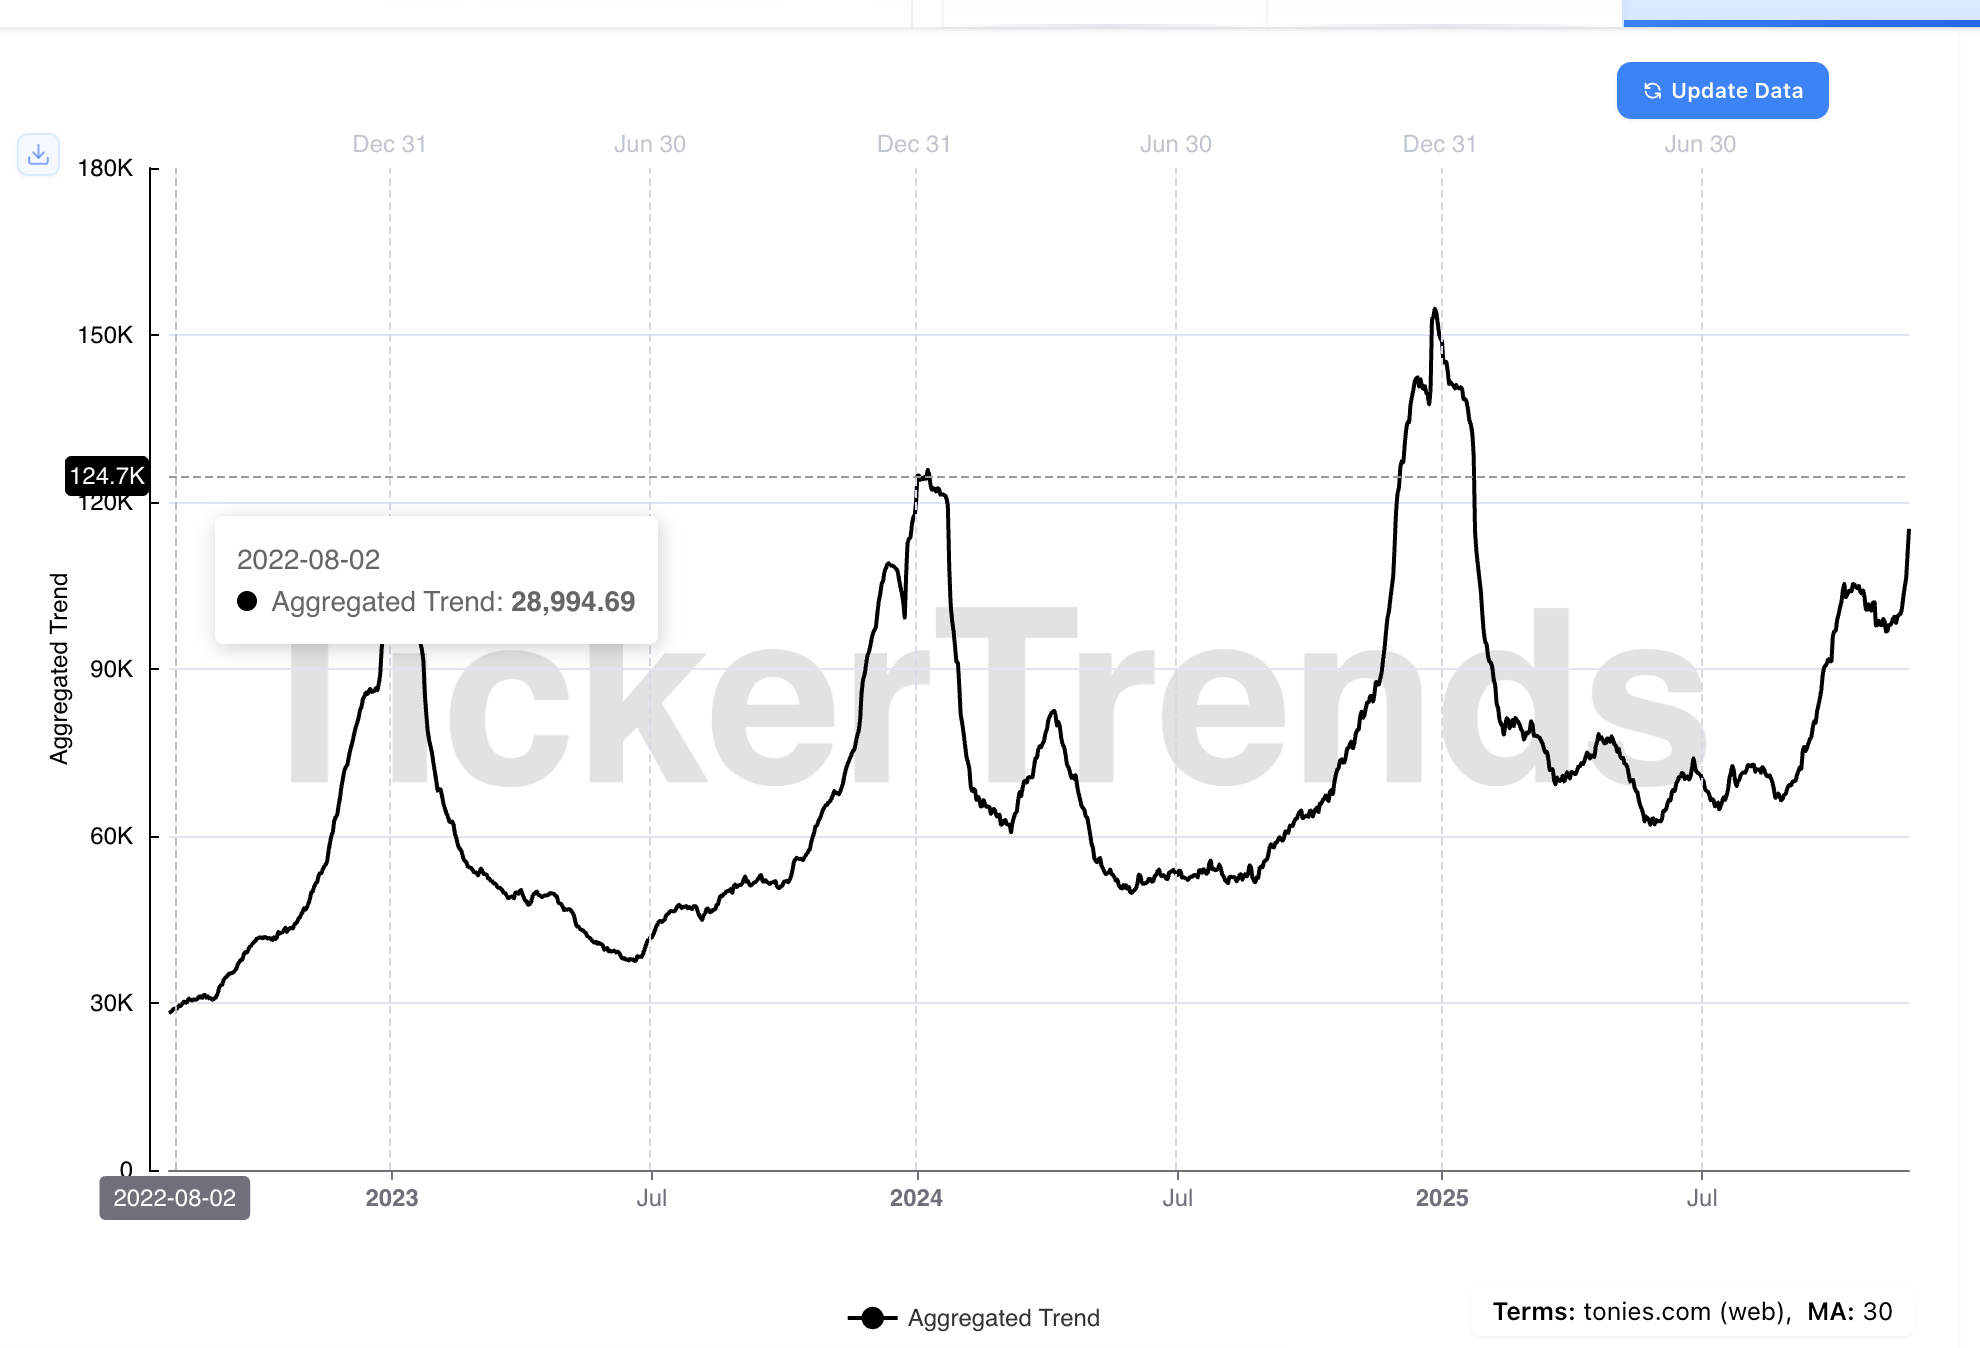
Web traffic is one of my favorite metrics to look at. I think it’s very helpful for internet / ecommerce names. Here is a graph with web traffic to tonies.com.
There is a lot of data to play with. Some datasets are helpful for specific types of companies — some aren’t. It really depends on your coverage. But what’s certain is that the Enterprise version of the software offers many datasets to explore.
TickerTrends can also be helpful for idea generation.
The KPI Screener, for instance, lets you scan the entire universe of tracked metrics (search trends, web traffic, app usage, social media signals, etc.) across companies, brands, and products.
You can sort and filter by specific data sources (i.e., Google Search, TikTok views), categories (i.e., apparel, fintech, beauty), or growth rates (i.e., highest YoY, etc.)
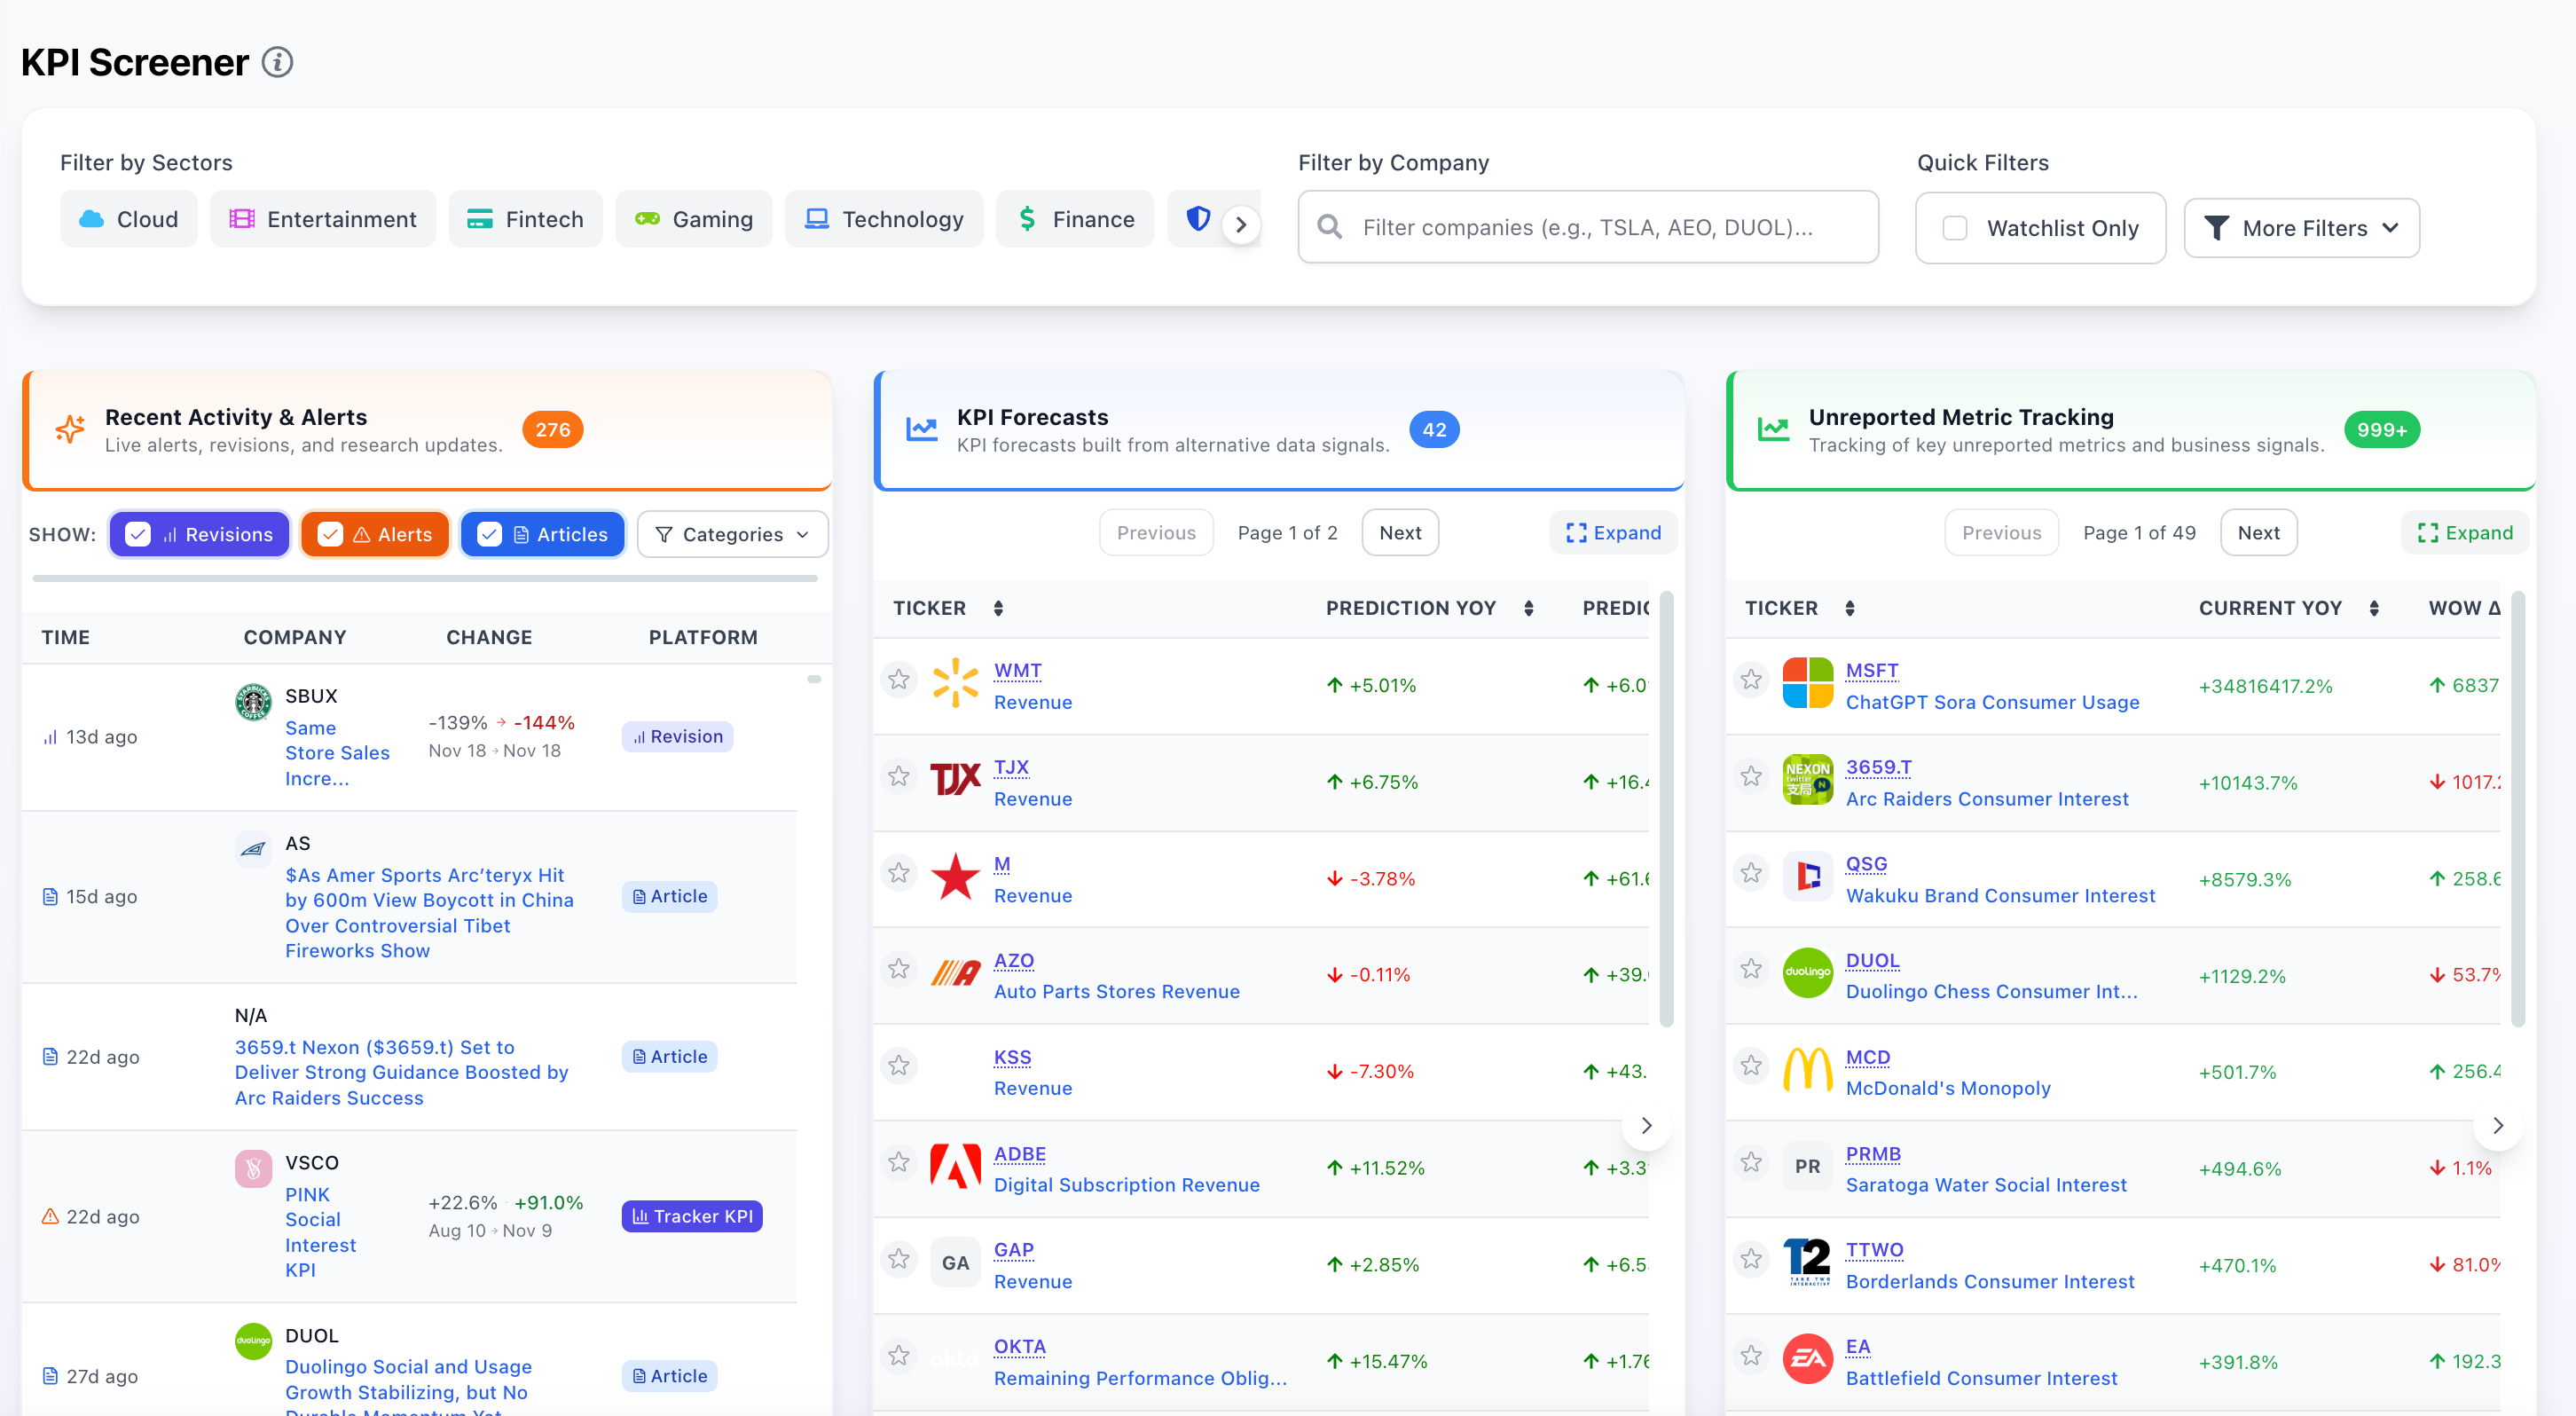
Likewise, you can use the Ticker Screener to filter and rank stocks based on their underlying trend strength in metrics such as consumer interest, social interest, and others.
Exploding Trends is another cool feature that highlights trending keywords, brands, and themes. It pulls from search, social, and traffic data to flag what’s accelerating right now. This can help identify early trends.
Stock coverage is solid from what I’ve seen thus far.
Many of the names I tend to look at (i.e., smaller, typically non-US) can still use unstructured data to pull search trends, web traffic, and other data.
If you want to add alternative data to your process, I think TickerTrends is worth exploring. I have been finding the software quite useful for my process, especially given my interest in consumer names.
If you are interested in an enterprise trial of TickerTrends, you should reach out directly to Marshall Mentz (marshall.mentz@tickertrends.io). If you reference Clark Square Capital, you can get a free two-week trial of the Enterprise version.
I hope this is helpful. Thanks for reading.
P.S. If the enterprise version isn't for you, TickerTrends also offers a lower tier for $1,000 per year, or about $100 per month, which could be worth checking out as well.
I found the way you integrate alternative data with TickerTrends very useful for anticipating potential shifts in market interest. The combination of consumer interest and social interest as aggregated metrics reminds me how alt‑data can complement traditional fundamental analysis: it’s not just about what the financial statements say, but about capturing early signals of user behavior before they become evident in the results.
In particular, the idea of looking at year-over-year changes or rates of change rather than absolute levels resonates with how I evaluate momentum and capture nascent trends in less-covered names.
That said, I’m curious: how do you balance alt‑data signals with the risk of noise or false signals, especially in indices with low coverage or volatile social data? That filter can be crucial to avoid overinterpreting signals that others haven’t validated with fundamentals.
Thanks for share!